In the digital age, everything is calculated and measured, from customer behavior to the progress of marketing campaigns. In addition, the feature of marketing expense reports has reached unprecedented heights, and ROI control has become the number one priority in the work of the management department.
Multichannel sequences
At the moment, web analytics tools such as Google Analytics, CoreMetrics, etc., use a “last interaction” attribution model to assign value to conversions. This means that the visitor made a purchase or action based on the last source. In Google Analytics, transactions are credited to the channel through which the visitor’s last interaction occurred.
Google Analytics provides the “Multichannel Sequences” report, which displays chains of interactions from different sources and channels. These user paths help understand which actions led to a conversion. Analyzing this type of report requires a special approach, attention to the details of its formation, and proper Google Analytics setup.
Conversions in the multichannel report
Conversions in multichannel sequences include:
➤ e-commerce transactions; ➤ established goal completions.

Selecting a set goal
Do not take into account meaningless conversion goals—events that will bring no benefit other than visiting a specific page.
Types of “Multichannel Sequences” reports
Through the “Multichannel Sequences” report group in Google Analytics, it is possible to assess: the interaction of advertising channels during a purchase; the time interval between the appearance of interest in a product and its purchase; the role of an advertising channel in completing or initiating conversions.

Reports included in the “Multichannel Sequences” category
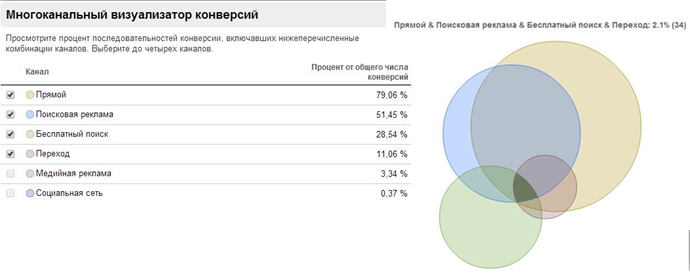
The overview includes the “Multichannel Conversion Visualizer,” through which we can clearly see how different traffic channels interact with each other.
Associated conversions demonstrate the role of any channel in attracting a customer and allow determining its role: initiating, assisting, or completing.
Primary conversion sequences. This shows the paths through which your customers reached a conversion.
Time to conversion and Sequence Length indicate how many interactions and days it took for a visitor to reach the goal.
Reasons for discrepancies between the multichannel sequences report and other reports:
➤ In multichannel reports, e-commerce data and goal completions assigned via the interface are summed, whereas in other reports they are counted separately; ➤ Reports in multichannel sequences are displayed with a 2-day delay.
Primary conversion sequences
This is a series of user interactions with online marketing channels over a period of no more than 30 days that led to a conversion. Let’s assume that the user used the following sources before making a purchase. The report will look like this:
The conversion sequence is recorded for each achieved goal, and the data is taken from a cookie named utma. In a given sequence, up to 5,000 different channels can be included.
Detailed conversion sequence
Each source in multichannel sequences can perform three actions in the conversion chain:
➤ Last interaction — the source whose visit occurred immediately before the conversion; ➤ First interaction — the source from which the conversion sequence began; ➤ Assisted — an associated source that was present in the chain but was neither the first nor the last during the conversion visit.

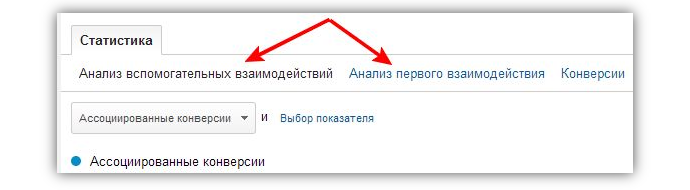
In the ‘Multichannel Sequences’ section, there are two reports that help understand at which point a particular channel most often contributes to a conversion: Assisted Interactions Analysis; First Interaction Analysis.

Types of channels in multichannel sequences
Traffic sources are grouped into channels, which can be edited at your discretion:
1. Channels that Google Analytics defines by default;
2. Custom channels (created by the user);
There is a basic group of channels, which you are not limited to. The user can organize new channel groups, segment them at their discretion, and assess the impact of the resulting segments on conversions. The illustration provides an understanding of basic and custom channels.
When creating a new group, you can copy the basic set of channels as well as create your own — for this, it is necessary to add a new “rule” on the editing page and specify its name and properties. In the report, rules are displayed as channels.
Conversion Sequence Analysis
You have the ability to analyze the transition sequences by changing the Primary Dimension in the ‘Top Conversion Sequences’ report. You can select one of the nine primary dimensions.
➤ Conversion sequence for the default channel group ➤ Source/Medium path ➤ Source sequence ➤ Channel sequence ➤ Campaign path ➤ Campaign path (or Source/Medium) ➤ Keyword path ➤ Keyword path (or Source/Medium) ➤ Landing page URL path
The following dimensions are useful for those who have linked AdWords with Google Analytics:
➤ AdWords campaign path ➤ Ad group path ➤ AdWords keyword path ➤ Ad content path ➤ Matched search query path ➤ Placement domain path ➤ Placement URL path ➤ Displayed URL path ➤ Destination URL path
Report Examples
Conversion path for the channel group in multichannel sequences: Keyword path; Source/Medium path. Why the metric ‘Assisted Conversions / Last-Click or Direct Conversions’ is necessary.
The meaning of this metric can be interpreted as follows:
➤ Closer to 0 – the channel primarily works at the final stage of the sequence ➤ Closer to 1 – the channel initiates and completes conversion paths equally often ➤ Above 1 – the channel primarily contributes at the user's first interaction
Analyzing your website through various attribution models will help you avoid mistakes with advertising budgets and correctly understand the value of each channel in the final transaction, significantly simplifying brand management.


