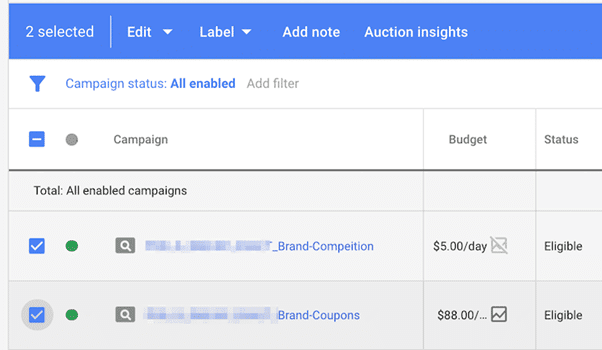
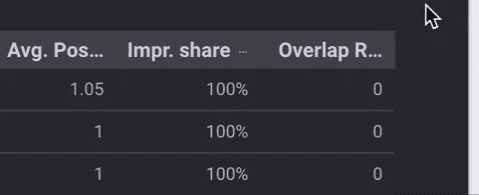
Data about competitors is very important for advertisers and contextual advertising specialists. This data is not always easy to collect and analyze. Here we will explain how this can be done quickly and conveniently.How many analyze competitors now: Current Google Ads interface. This is the simplest method — just select the desired campaigns, then go to the “Auction Insights” section.
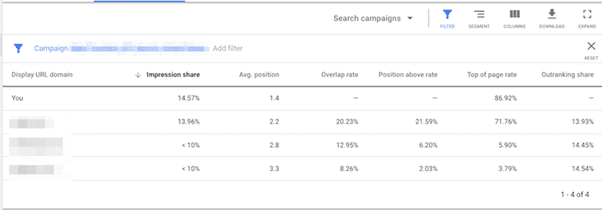
The results are not very impressive. There are no charts or graphs, and the segmentation options are also limited.
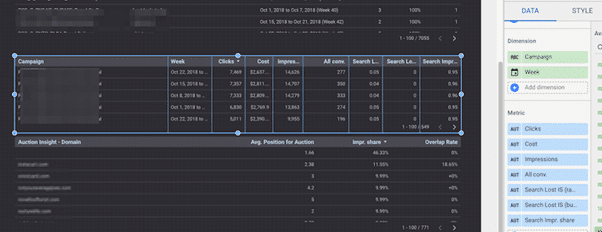
Interface Limitations When viewing or exporting data from the interface, you cannot segment campaigns, which complicates the analysis of your data. The only option is to pre-filter campaigns before downloading the data. In the Google Data Studio interface, there is a great opportunity to extract data at the campaign level. Here is a brief description of how to set up this report:
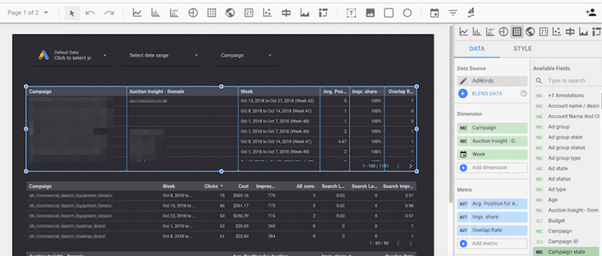
After you set up the report, click “View.” Then use the drop-down menus to select the account and date range, as well as any specific campaigns if applicable. Next, hover your cursor over the table until you see three dots appear in the upper-right corner. Click those dots, and then select “Download CSV.”
Repeat this process, but this time for the campaign data.
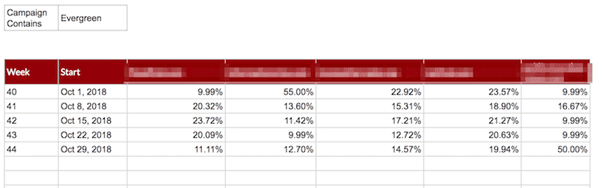
Here you can use filters in Excel to view and group the data, but I prefer using Google Sheets to take advantage of the Query functionality. Another reason to export data from Data Studio is that you can create charts of key competitors by week.
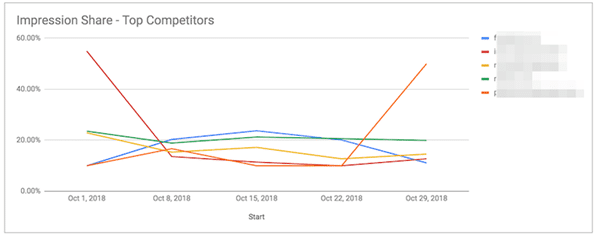
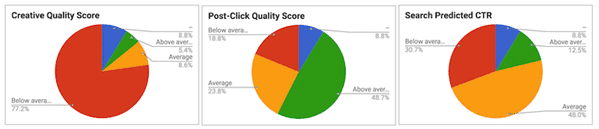
You can also create reports that show the share of lost impressions due to rank and budget. If you’re losing a large portion of impressions because of rank, pay attention to your bids and Quality Score.